Real-time Dashboards
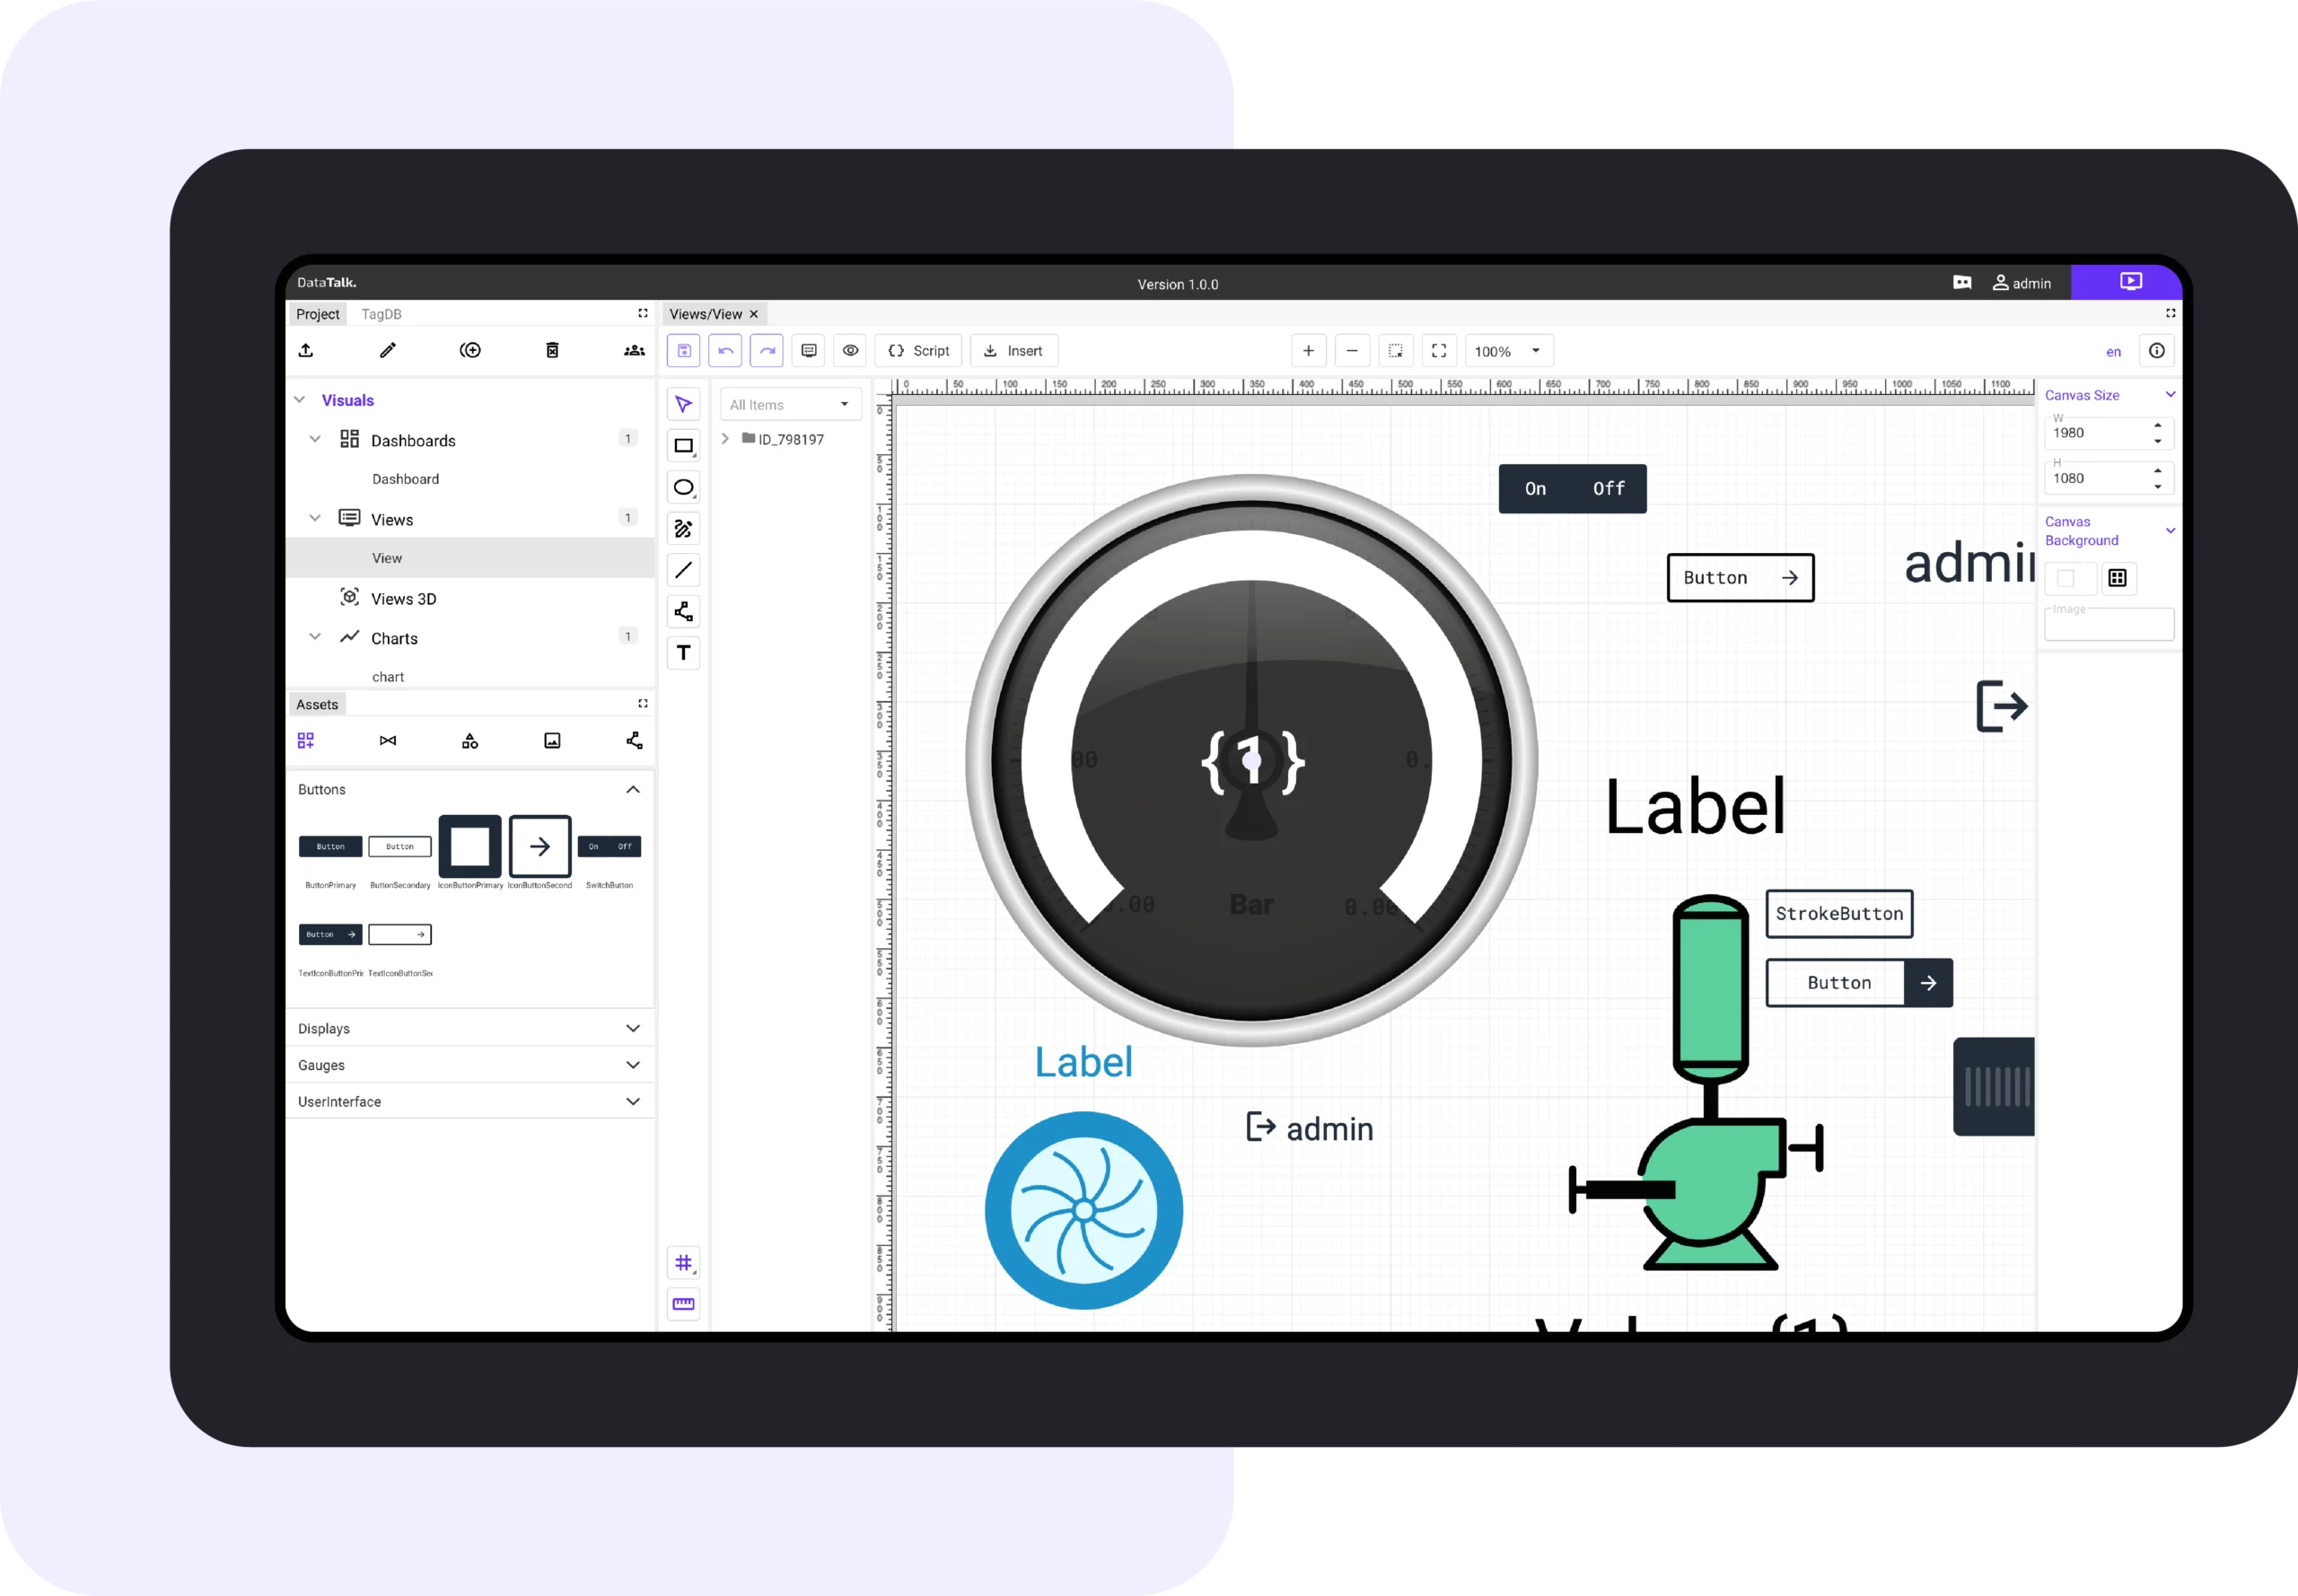
DataTalk Real-time Dashboards simplifies technology monitoring with one-click installation, combining data collection, logging, and visualization into a user-friendly platform. Connect machinery, PLCs, sensors, or databases for instant, real-time dashboards with 200+ interactive components, charts, data aggregation, and user management—all designed for intuitive monitoring.
“Say goodbye to complexity and hello to intuitive technology monitoring with DataTalk Real-time Dashboards.”
Main Features
Read data from PLCs, IIoT sensors, MQTT, and databases
Log data into a time-series database
Combine live and historical data using rich graphical components
Use charts, gauges, PI & D symbols, maps, and over 200 more components
Key Benefits

Tady bych možná vložil nějaké schéma?

All-in-One solution
Realtime Dashboards combine data collection, logging (historian), and a graphical interface into a single product.

Simple configuration and management
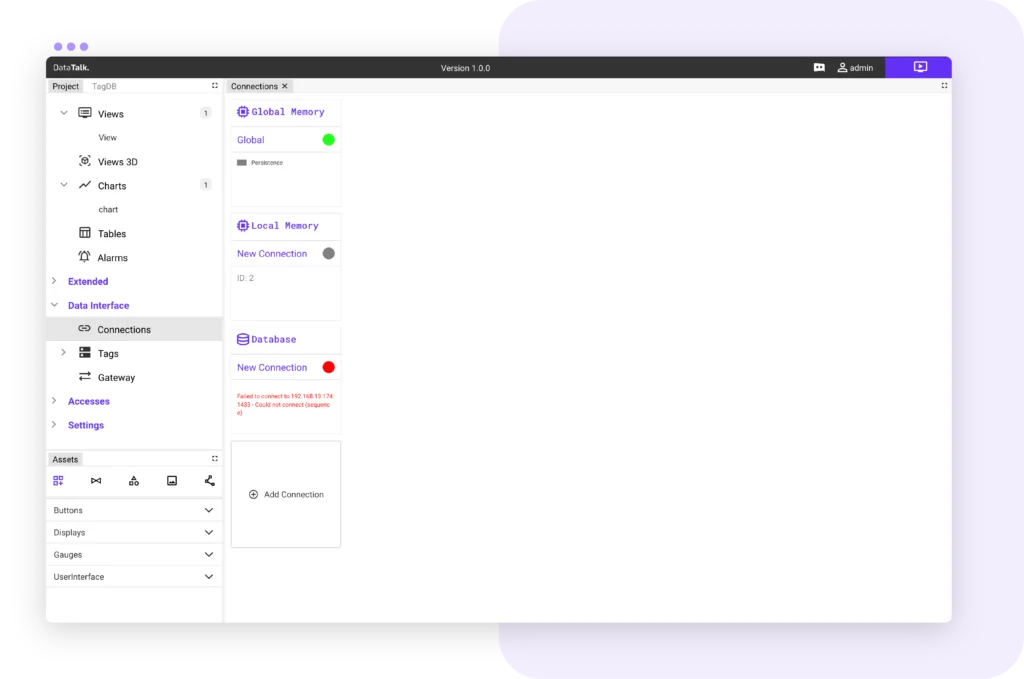
All settings are managed directly through an intuitive web interface, blurring the line between project creation and usage.
How does it work?

01
Connect to Devices
Integrate Dashboards with controllers, databases, or sensors and specify the data you want to collect and analyze.
02
Link Data Sources
Use the integrated data transformation tool to connect various data sources easily, calculate supplementary values, or normalize the data.


03
Create Visualizations
Build live and historical charts, aggregated time-series graphs, or data tables tailored to your needs.
02
Design Dashboards
Leverage over 500 graphical components. Combine charts, tables, and other visualizations into comprehensive dashboards.

Compared to Competitors
Get an overview of DataTalk advantages
All-in-One solution:
Unified platform for data collection, analysis, and visualization.
Easy configuration:
No programming or scripting required.
Integrated time-series database:
Automatic time-series data storage.
Real-time updates:
Data is refreshed in real-time.
Data transformation:
Easily connect and normalize data using a graphical editor.
Effortless management:
No complex database or user access administration.
Extensive component library:
Access to over 500 visualization elements.
Key Advantages

Easy deployment
No complex SQL queries or scripting are necessary.

Intuitive data linking
Quickly and efficiently link data using the graphical tool.

Free version for testing
Test the non-commercial version at no cost.
Pricing
Licences
Our pricing is based on the project size (number of tags), all the rest are unlimited. Products are not limited by features! No hidden costs, just a clear, fair deal.
Personal
For non-commercial projects only.
$0
Lifetime license *
- Unlimited number of clients
- 50 Tags
- Community support
S
For small and mid-sized projects.
$400
Lifetime license *
- Unlimited number of clients
- 150 Tags
- Limited support
M
For mid to large projects with no compromise.
$1 200
Lifetime license *
- Unlimited number of clients
- 1 500 Tags
- Full support
L
Unlock an unlimited world of experiences.
$
On request
Lifetime license *
- Unlimited number of clients
- > 1 500 Tags
- Premium support
Modules included in DataTalk Real-time Dashboards product:
Data In
Compute
Data logging
Project Builder
Dashboards
Components library
Charts
Views
3D views
Don’t Overthink it
Download now and be amazed! It’s completely free and quick.
* 1 year updates are free. Update to the latest version +20 % /year.
Community support – e.g., forums, basic FAQs / Limited support – email, seven working days response / Full support – email, three working days response, SLA option / Premium support – priority email and phone support, one working day response, SLA option.
download
Information material
The most important information about our products at a glance
Get in touch
We look forward to hearing from you
We are interested in your comments, ideas, compliments, or critics.
You can contact us via info@data-talk.eu. We will be happy to respond.
Contact info
main office
Velvarská 1699/29
160 00 Prague
Czech Republic
LEgal office
Na Kodymce 973/1
160 00 Prague
Czech Republic